|
||||||
BDS
National Dragonfly Atlas to be published in 2013:
|
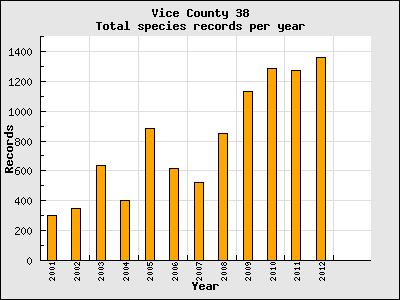 |
The histogram shows the
number of records per year for the period 2001 to 2012 - the recording
period
for the New BDS Dragonfly Atlas. Over a thousand have been received for
the final four years. In the whole atlas recording period the total is
9547 records. The total number of records sent in by recorders in 2012 was 1379. Some were for earlier years and of these some were the first for a species in10km squares for the atlas recording period. The total for 2012 was 1359 and of these 1326 are for VC38, the other 33 for Staffordshire, VC39. The VC38 total is the maximum ever achieved for a single year's recording. |
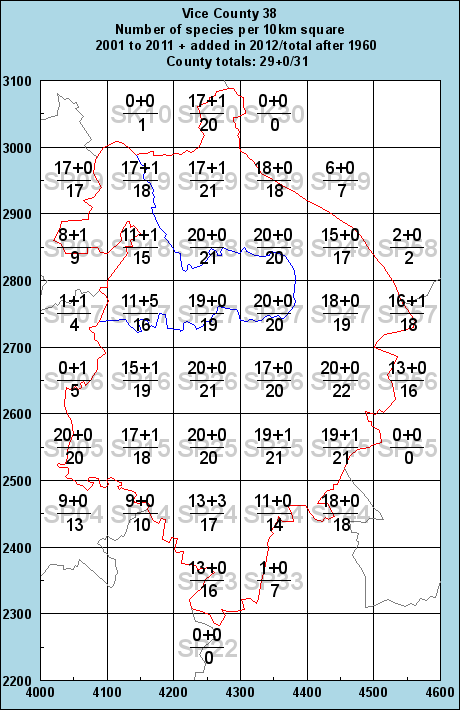 |
This map is
an analysis of the records for VC38 during 2012. In each 10k square the
first figure above the line is the number of species recorded in that
square for the recording period 2001 to 2011 and
the figure following
the plus sign is the number of new species recorded in 2012. The
total number of species seen in each square from 2001 to 2012 is
the sum of these two numbers. The figure below the line is the number
of species recorded in the period 1960 to 2012. Additional
species were recorded in 13 squares 2012 and, notably, 5 in SP17. |
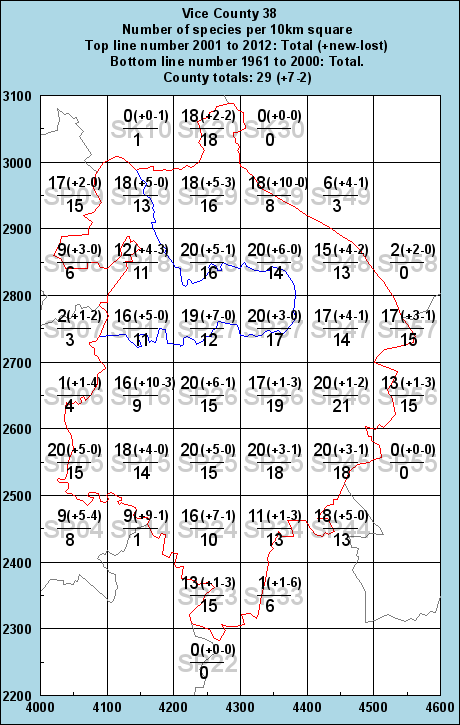 |
The map on the left is an
analysis of the records for VC38 comparing, for each 10k square, the
total number of species recorded in the atlas period 2001 to 2012 with
the number in the previous period 1961 to 2000. The figure for the
atlas period is the first one on the top and the one on the bottom for
the earlier period (note, this figure is for a different period than
that in the previous map). On the top, the positive and negative
numbers in the brackets are, respectively, new species recorded in the
atlas period and species seen in the earlier period but not during the
atlas period. To an extent, the negative numbers represent "lost
opportunities" for recording of species in the square however some of
the "missing" species are rarities which would require a lot of luck to
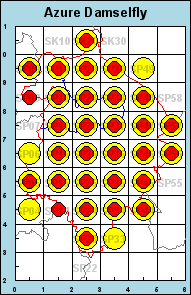
see. The
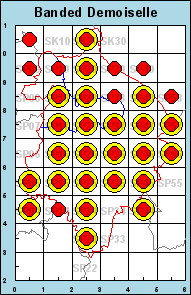
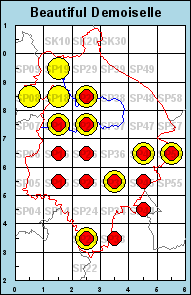
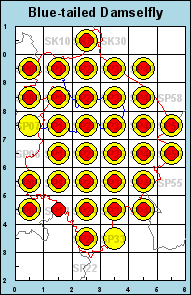
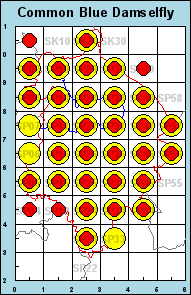
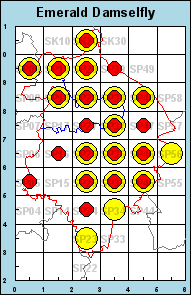
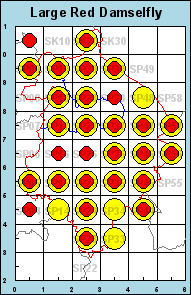
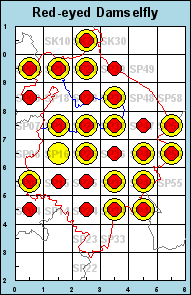
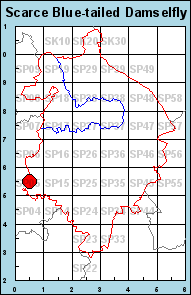
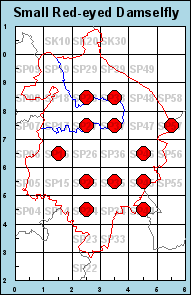
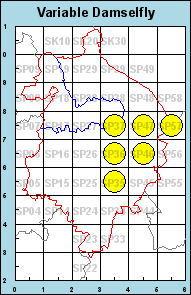
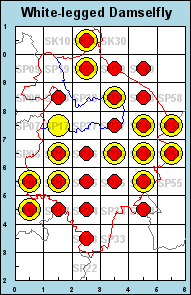
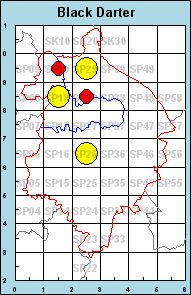
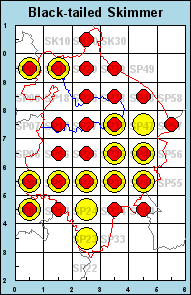
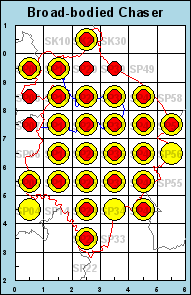
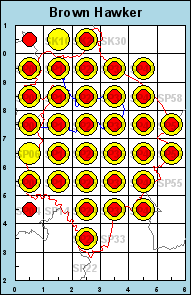
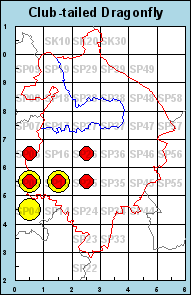
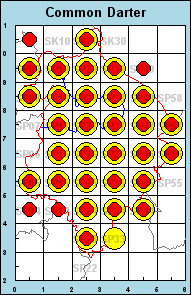
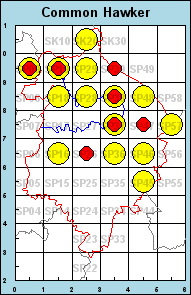
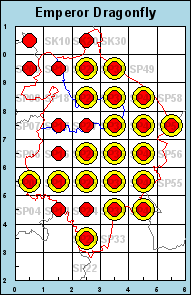
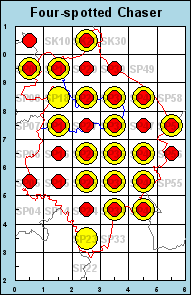
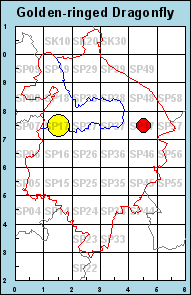
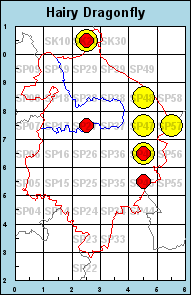
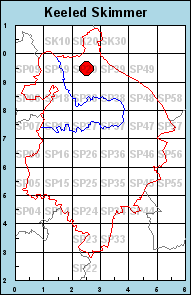
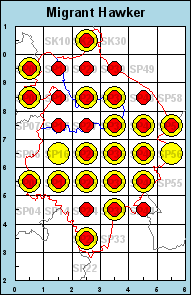
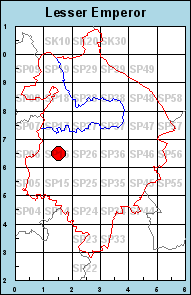
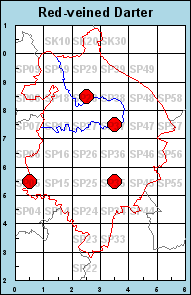
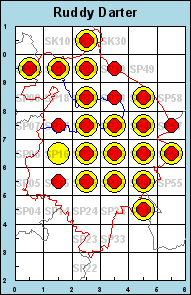
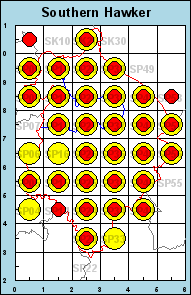
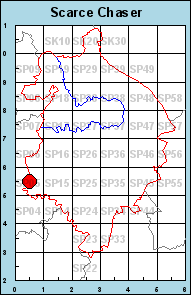
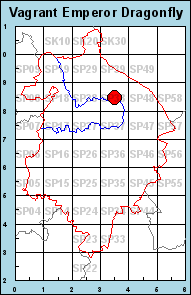
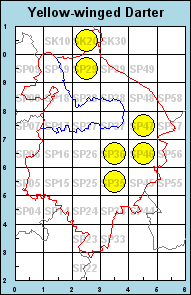
recorded status of each individual species is shown on maps
below for where they occur in squres for the periods 1961 to 2000 and
2001 to 2012 and for the whole perioc 1961 to 2012 |
Damselflies
Dragonflies
 2001 to 2012
 1961 to
2012
 1961 to 2000
Banner artwork by Joan Sharrett
Last updated Tue Jan 01 18:14:06 2013 | Visits since Oct 2010: 15713 |